.png)
Sprint performance is decisive in competitive sport. Across most field-based disciplines, the capacity to accelerate and sustain high-speed running can be the difference between winning and losing, whether breaking away from a defender, closing down space, or converting a counterattack into a scoring opportunity. Yet sprinting is also one of the most injury-prone actions in sport. Nearly half of all hamstring strain injuries occur during sprinting — a concerning figure given that hamstring strains account for 24% of all injuries in men's professional soccer and have doubled in incidence over the last two decades [1] — with a notably high recurrence rate of 18% [2].
Performance and medical staff have long grappled with both sides of this challenge. Developing the sprint qualities that win matches while keeping athletes healthy enough to play them demands rigorous monitoring. Yet sprint assessment remains a critical bottleneck: how do you evaluate sprint mechanics at scale, with sufficient precision, without pulling athletes out of training and into a laboratory?
The default answer has been video. A camera on the sideline, footage manually reviewed, a skilled eye doing the interpretation. That workflow has real value, but it also carries structural limits. Manual visual assessment is inherently subjective, dependent on the experience and judgment of the observer, and difficult to standardize across staff or over time. It is also constrained by frequency, since pulling analysts into a full review is rarely feasible, and by perspective, since a single side-view camera captures only a part of what is biomechanically meaningful.
Today, we are releasing Model Health’s Sprint module to solve that.
The limits of current sprint assessment
The first constraint is manual labor. Rigorous sprint analysis requires a trained analyst to scrub footage frame by frame, identifying key events — initial contact, midstance, toe-off, maximum vertical projection, late swing — before any biomechanical interpretation can begin. Layered on top of that is the interpretive layer: converting raw mechanics into conclusions that are actionable. Frameworks like S-MAS [2] formalize that translation, but they require significant time per athlete to apply rigorously. The more experienced the eye, the less such scaffolding is needed, but across a full squad monitored over a training block, the cumulative burden makes systematic assessment either impractical or superficial.
The second constraint is dimensionality. Sprinting is a 3D task, yet most assessment tools operate in 2D. The majority of video-based workflows are bound to a single viewpoint — most often sagittal — which captures stride length and knee drive reasonably well, but is structurally blind to what happens in the frontal and transverse planes: pelvic control, rotational mechanics, upper-body torsion.
Multi-plane sprint analysis with automated S-MAS
Model Health's Sprint module is built to address both constraints. No specialized hardware. A simple multi-smartphone setup captures sprint mechanics across multiple viewpoints, enabling full 3D analysis. The result is near-instant (<5 minutes) metrics spanning both performance (top speed, step frequency, contact time, flight time) and injury-risk mechanics, with automated S-MAS scoring delivered at scale.
Automated 3D reconstruction, event detection, and S-MAS scoring
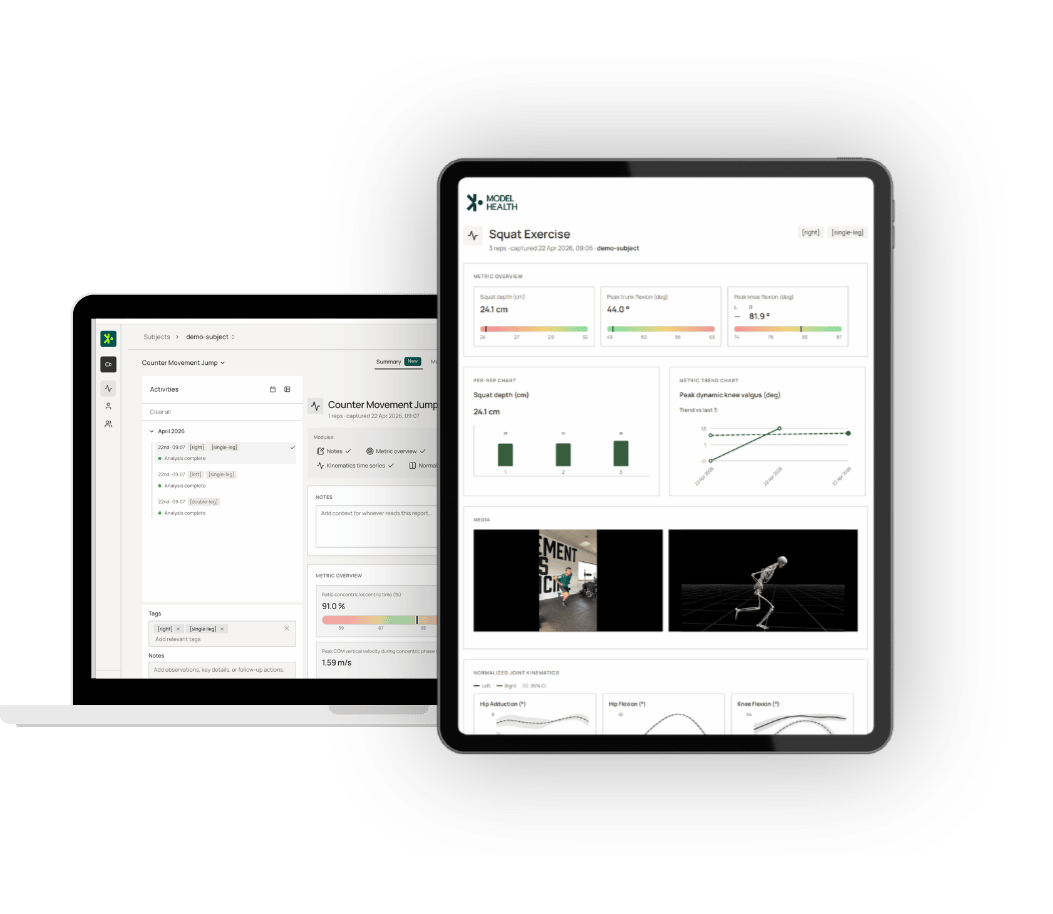
The module processes multi-view video into a 3D motion reconstruction, from which kinematic time series are derived and S-MAS item scores are computed. Synchronized original footage, 3D reconstruction, and kinematics are all accessible in the web application, while automatically generated reports further include S-MAS item scores and frontal and sagittal kinograms exported from the 3D reconstruction.
Key sprint events are detected automatically. Our segmentation algorithm achieves a mean absolute error of 15 milliseconds against manual labels across five events: initial contact (touchdown), midstance (foot directly below the center of mass), toe-off, maximum vertical projection (moment of highest center of mass position), and late swing (moment of maximum knee extension during the swing phase). Variability in event placement accumulates across sessions and staff in ways that quietly undermine longitudinal tracking — and that consistency is difficult to guarantee in a manual workflow at scale.
By reconstructing motion in 3D, the module enables 3D kinematic analysis by default — which matters for sprinting assessment even within an S-MAS workflow. Longitudinal torso rotation, for instance, is difficult to score reliably from a sagittal view alone. Similarly, stance-leg collapse — covering excessive knee and ankle dorsiflexion during stance — often cannot be assessed conclusively without also evaluating pelvis stability. Unless the collapse is overtly clear, the sagittal view alone is insufficient. 3D measurements provide the necessary context to make these judgements with confidence.
To see what this looks like in practice, we walk through two case studies below.
Athlete 1 — A connected pattern of mechanical inefficiency
Five S-MAS items are flagged for Athlete 1.
S-MAS item scores for the last captured cycle per leg. Red values exceed threshold and warrant further investigation.
At first glance, they may look like a list of independent issues. The kinograms show they are not — they are a connected pattern. The sagittal view tells the first part of the story. The trailing leg stays extended too long after toe-off, producing an early back kick instead of a rapid recovery into flexion. By the time the foot approaches initial contact, the athlete is leaning forward with the trailing thigh too far behind the lead thigh — a negative thigh separation that directly corresponds to flagged S-MAS items. The slow leg recovery also means the swing leg is not in front of the stance leg at midstance, a further marker of disrupted stride mechanics.

The frontal view confirms what the sagittal view already suggested. Pushing too long — and too far behind the center of mass — is strongly implied by sagittal mechanics alone, but it is the frontal plane that makes the consequence visible: the prolonged push introduces longitudinal rotations through the trunk, and in this case excessive hip rotation as well. The latter is its own signal, indicating that force is not being applied effectively. The trailing leg cannot recover quickly because the body is still managing that rotational load.

Athlete 2 — A cleaner profile, with one area to watch
The primary flagged S-MAS item is forward torso lean at initial contact. Elsewhere the profile is mostly positive — backside mechanics are clean, with no back kick, good hip extension at late swing, and positive thigh separation.
S-MAS item scores for the last captured cycle per leg. Red values exceed threshold and warrant further investigation.
In the sagittal kinograms, the difference from Athlete 1 is immediately visible. Hip flexion begins promptly after toe-off, the trailing leg recovers efficiently, and the swing leg is well in front of the stance leg at midstance — all consistent with the S-MAS scores.

The frontal view is confirmatory. As expected from the clean switching coordination seen in the sagittal plane, pelvis control during stance is good and no unnecessary rotations are introduced. This is reflected in the reduced hip internal rotation and upper-body rotation visible in the figure compared to Athlete 1.

Logged Assessments: Track progress and benchmark teams objectively
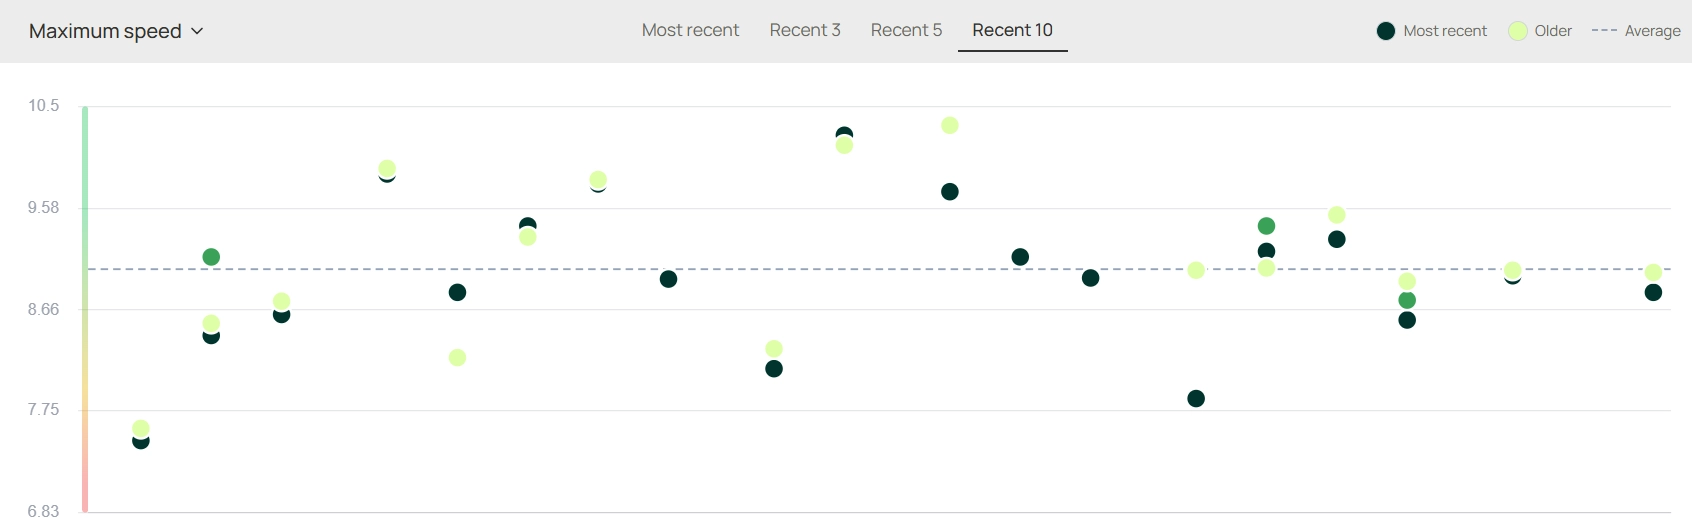
Every session is stored. The same S-MAS metrics computed at capture are queryable over time — for an individual athlete across a training block, or across a full squad at any point in the season. Changes in switching quality, trunk control, or contact efficiency accumulate into a longitudinal record rather than remaining isolated snapshots.
For performance staff managing a group, the team dashboard provides a structured view across athletes and trial sets. Patterns that are difficult to detect when reviewing athletes sequentially — a cohort-wide tendency toward overstride, a cluster of elevated trunk rotation scores, an individual whose metrics shift around a congested fixture period — become visible when the data is aggregated. Individual analytical depth and squad-level breadth operate from the same capture, the same processing pipeline, and the same structured output.
The practical implications for squad screening
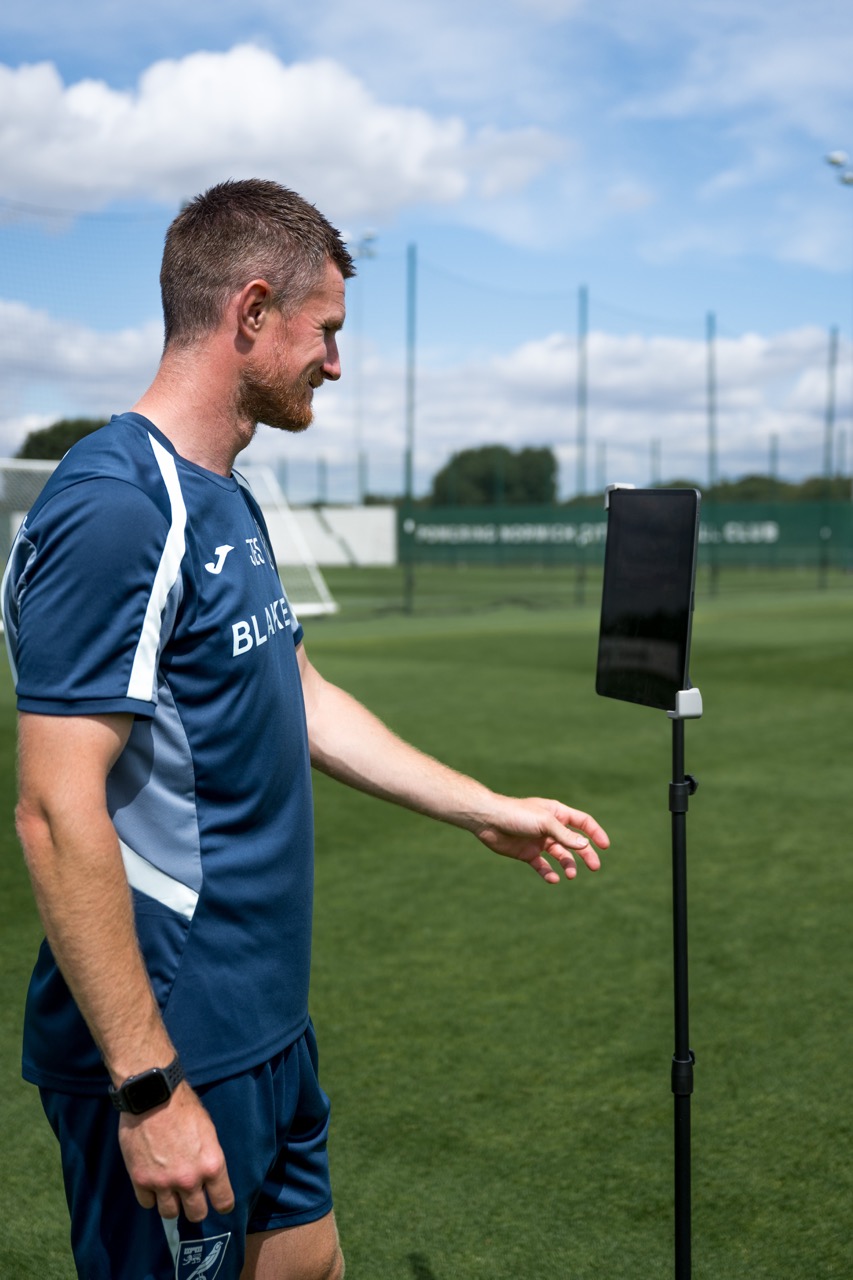
Like every movement we support, the Sprint module is designed for where sprint assessment actually happens: the training field. The output is the kind of biomechanical data that, until recently, required motion capture infrastructure to produce.
There is no single correct sprint technique — individual variation among elite sprinters is well documented. What matters is the reliable identification of movement patterns that are mechanically costly or clinically significant. For performance staff working across a full squad, this brings biomechanical sprint assessment into routine screening: not as an occasional specialist referral, but as part of standard monitoring. Mechanical inefficiencies become surfaceable without additional setup, and athletes with injury histories or identified performance gaps can be flagged and prioritized from the same capture used for the rest of the group.
The combination of automated event detection, automated S-MAS scoring, true 3D reconstruction, and longitudinal data storage addresses the constraints that have historically made that kind of monitoring impractical at scale.
The Sprint module is available now. For more on how Model Health's platform works, visit modelhealth.io/product/app
References
[1] Ekstrand J, et al. Hamstring injury rates have increased during recent seasons and now constitute 24% of all injuries in men's professional football: the UEFA Elite Club Injury Study from 2001/02 to 2021/22. British Journal of Sports Medicine, 2023. https://pmc.ncbi.nlm.nih.gov/articles/PMC9985757/
[2] Bramah C, et al. Exploring the Role of Sprint Biomechanics in Hamstring Strain Injuries: A Current Opinion on Existing Concepts and Evidence. Sports Medicine, 2023. https://pmc.ncbi.nlm.nih.gov/articles/PMC11052868/


).png)
.png)