Introducing custom report layouts, in the app and in PDF
A single countermovement jump produces more than a dozen metrics. Jump height, eccentric and concentric time, modified reactive strength index, peak knee and hip extension speed, peak knee flexion and dynamic knee valgus at landing, and more.
Every one of them is useful in some context. Looking at all of them at once rarely is.
Which ones matter and how to show the results depends on who reads the report. A referring clinician might want the joint kinematics and the asymmetry figures. A performance coach might want two or three numbers that change what happens in training this week. An athlete might want to see how they move to understand what they should adjust. A report built for all three at once tends to work for none of them.
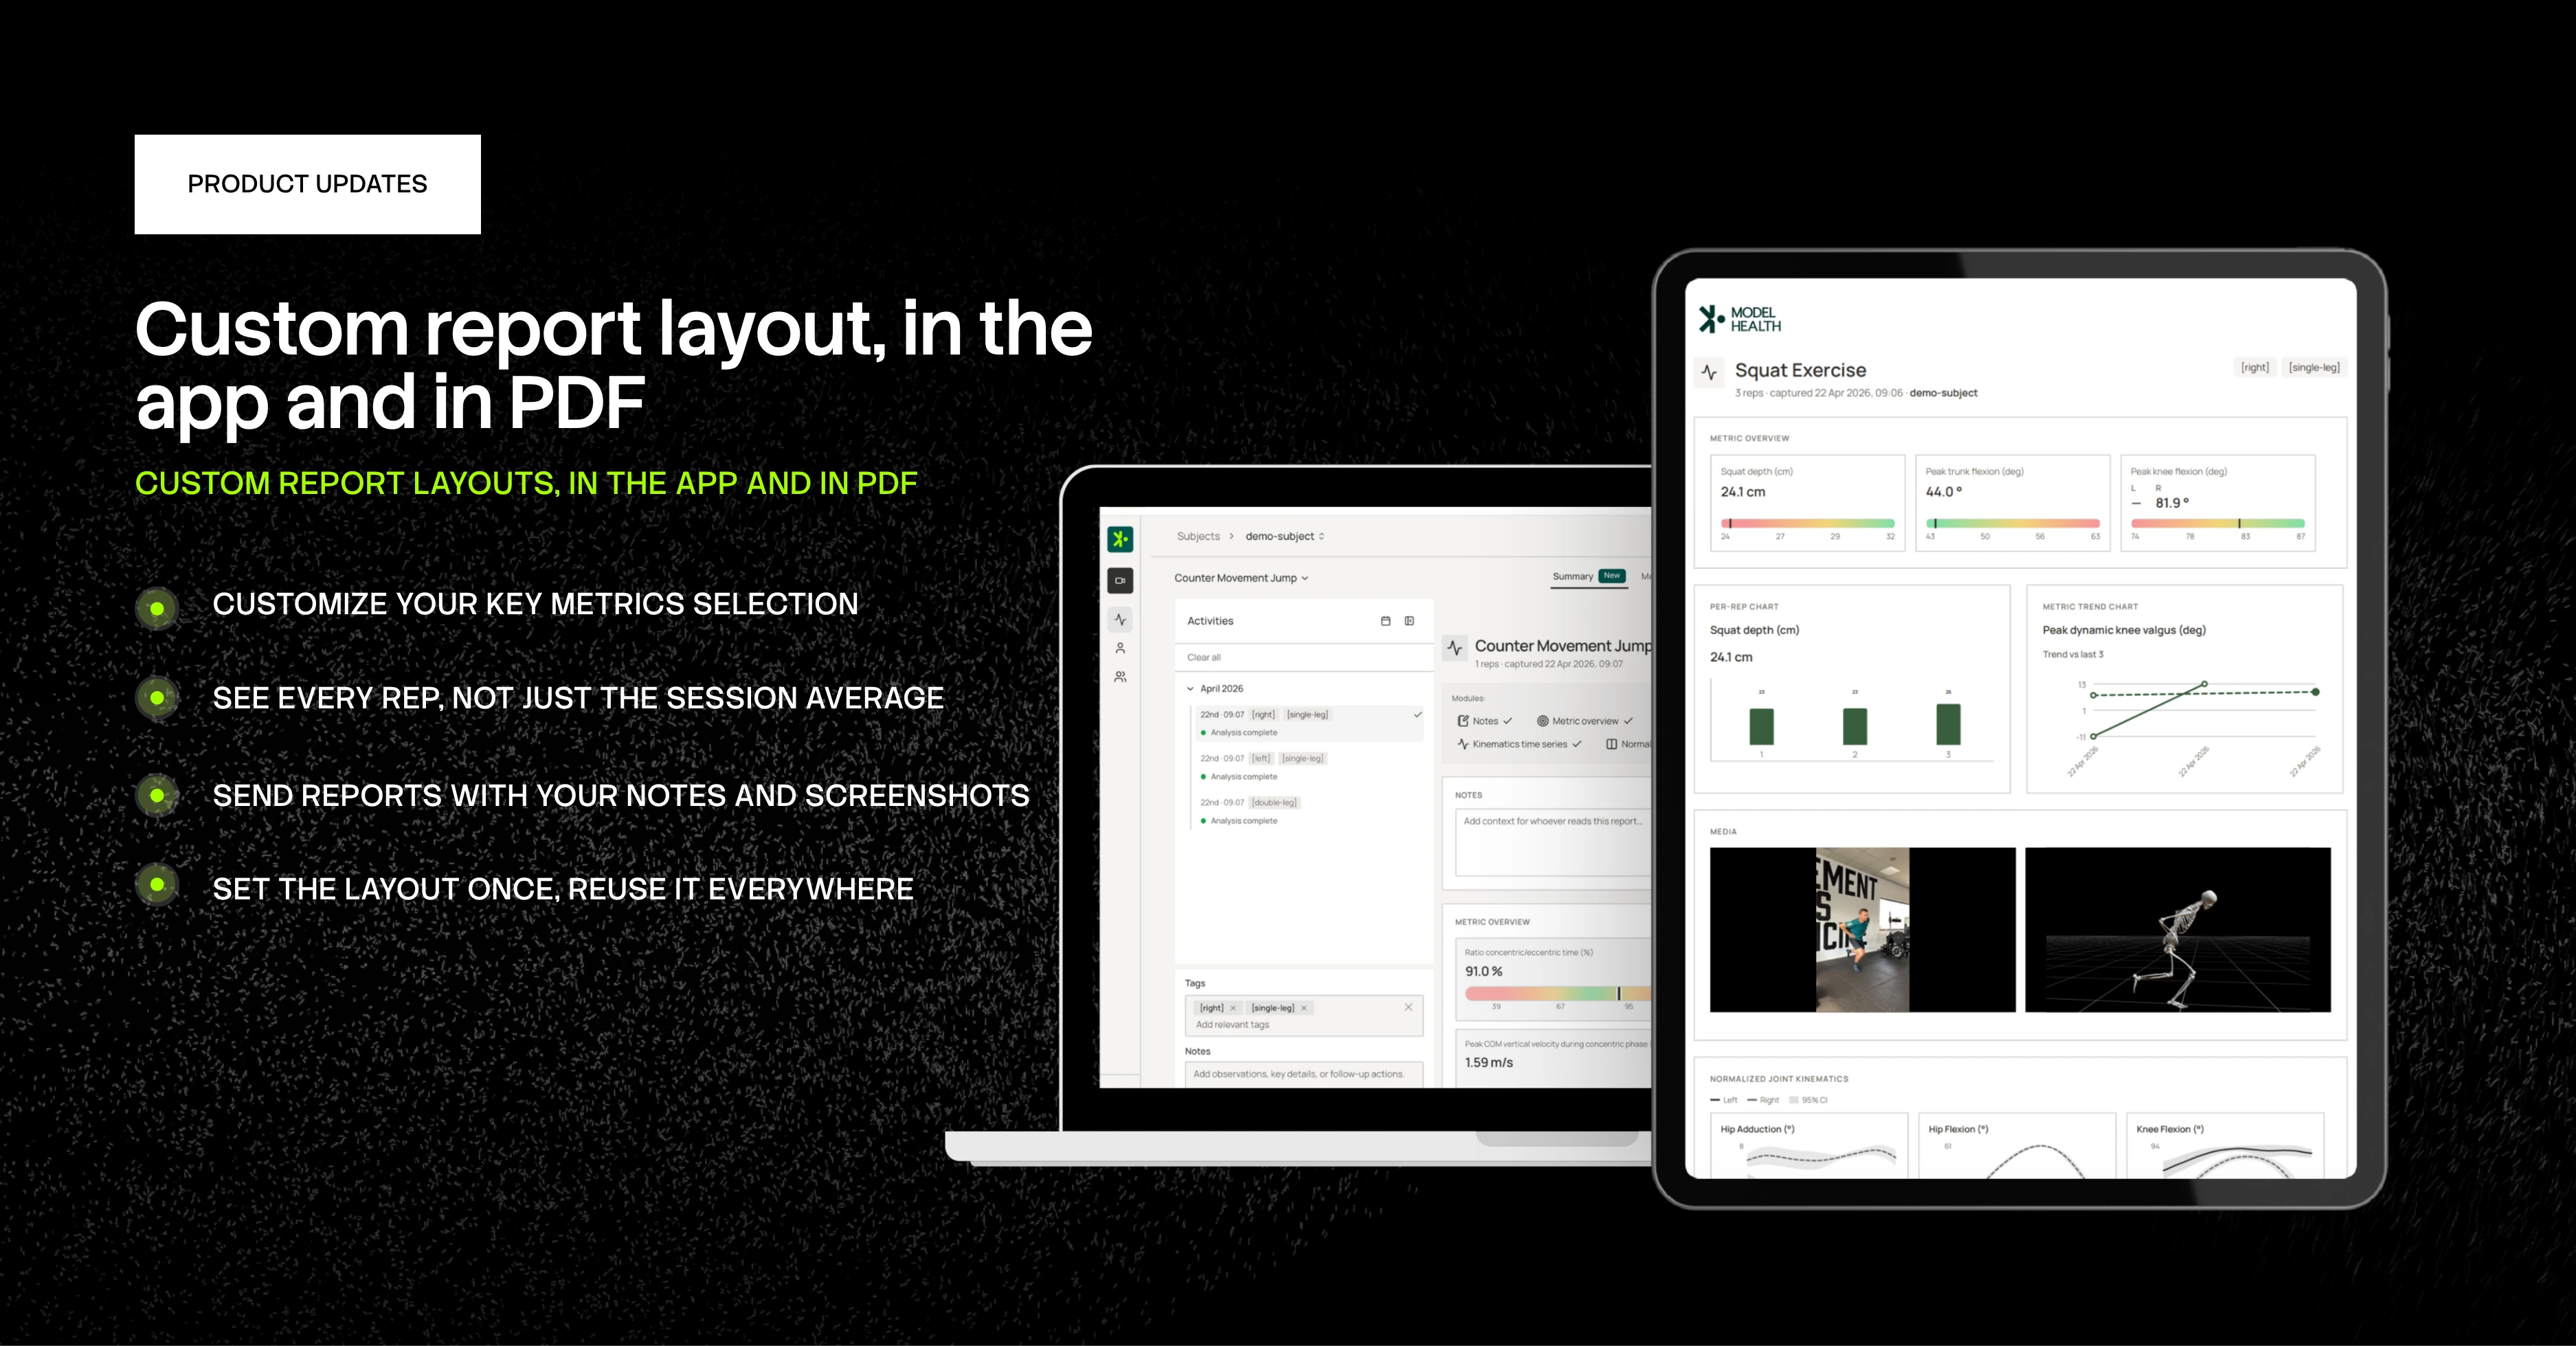
In our latest software update, we made your dashboard and report easily customizable: choose which metrics lead, access results for each repetitions individually, add handover notes, include video and 3D movement snapshots, and show how a metric has moved over time.
What's in the update
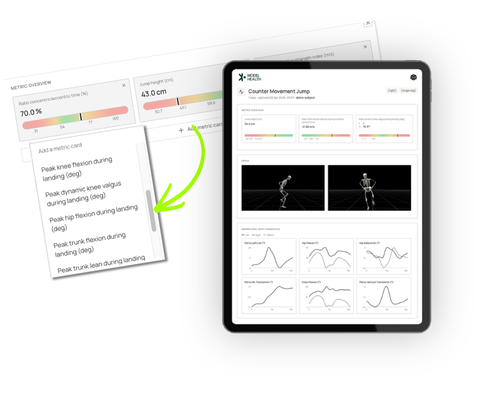
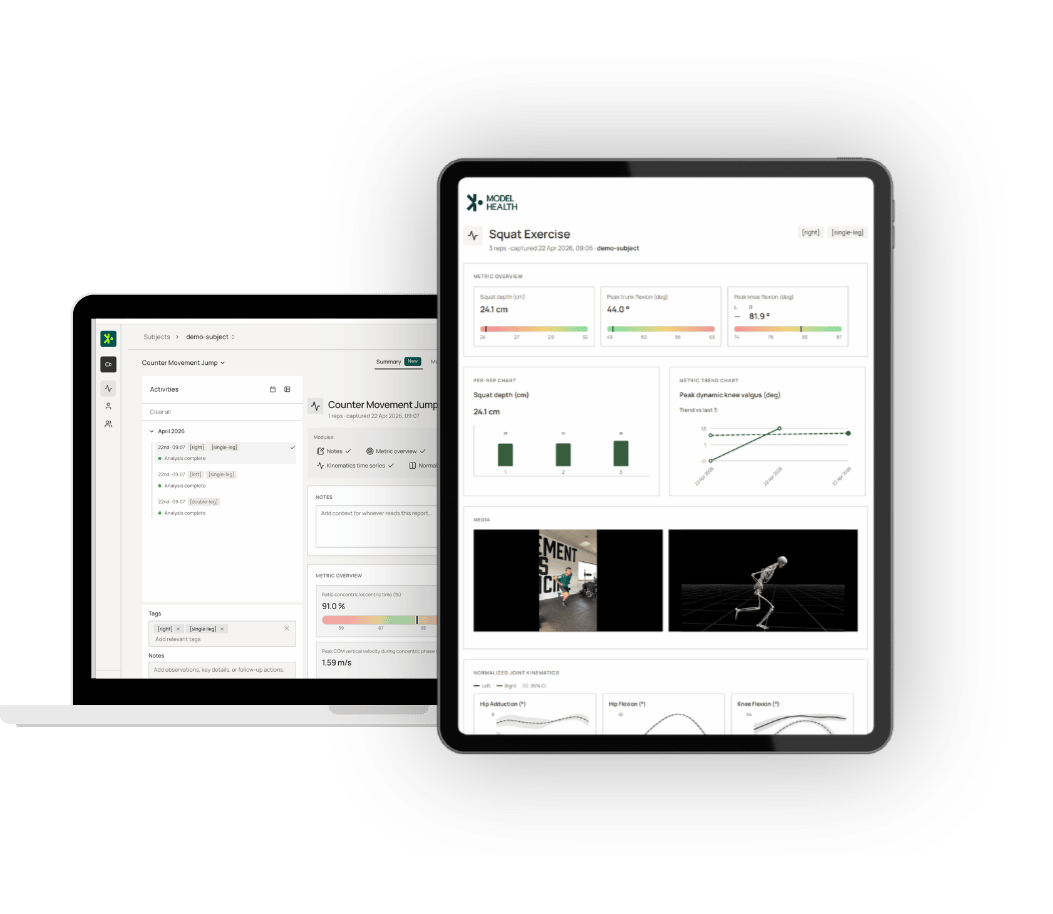
A new Summary tab, accessible from your dashboard, is where you build the handover.
You choose which visualization you need from a library of 9 pre-built modules:
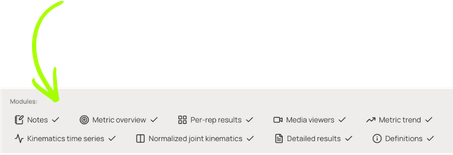
- Notes: free-text context you write.
- Metric overview: headline metric cards with normative ranges
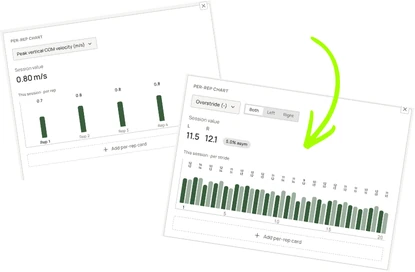
- Per-rep results: values broken down rep by rep or stride by stride
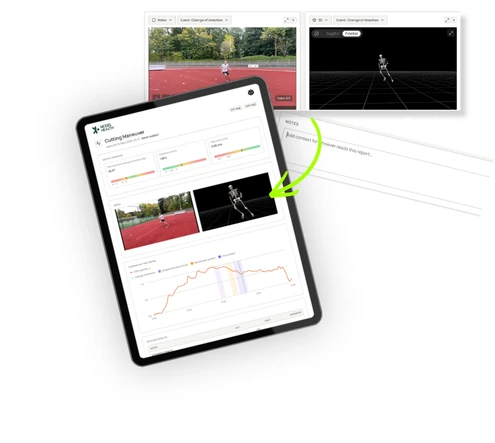
- Media viewers: video and 3D reconstruction panels
- Metric trend: how a metric has moved across previous sessions
- Kinematics time series: joint angles plotted against time
- Normalized joint kinematics: joint angles normalized across the movement rep or cycle
- Detailed results: the full metric table, per-rep or aggregated
- Definitions: plain-language explanations of each metric
You can save your layout as a template that carries across all activities of the same type.
None of this changes how the biomechanics are computed. It changes what happens to them afterwards, which is the part of the workflow where most of the value lies.
Available today
The new Summary view is accessible from the dashboard menu: select a subject and an activity, use our default layout and/or adjust it to your need.

).png)


.png)